The service is slow. Someone has a theory. Three days later the theory was wrong and the optimisation shipped anyway.
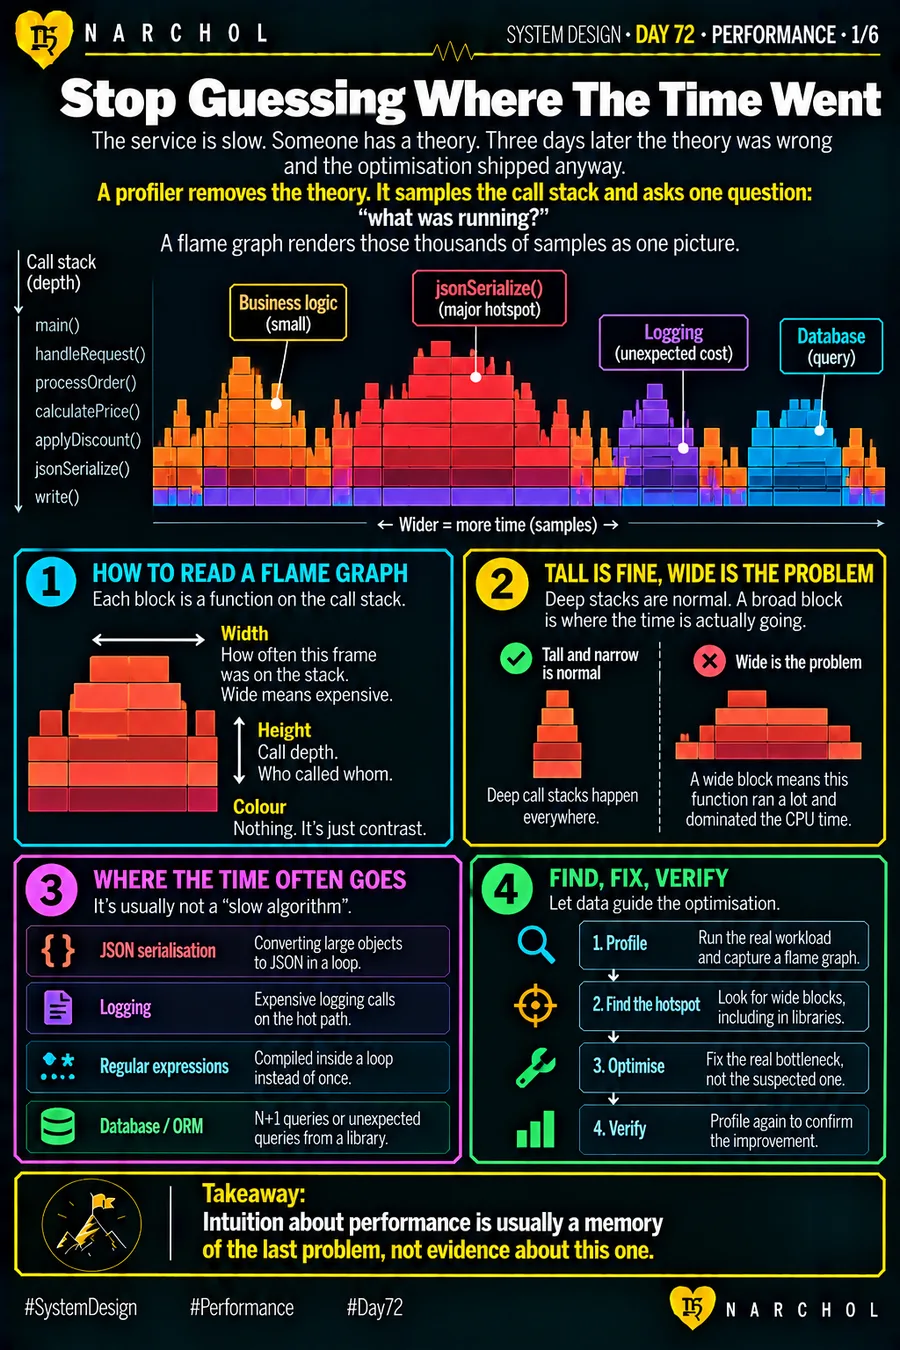
A profiler removes the theory. It samples the call stack thousands of times and asks one question — what was running? A flame graph draws all those samples as a single picture.
Reading one takes about a minute. Each block is a function on the stack. Width is how often that frame was there, so wide means expensive. Height is call depth, who called whom. Colour carries no meaning at all; it's there for contrast.
Which gives the rule: tall is fine, wide is the problem. Deep call stacks happen everywhere. A broad block is where the time is actually going.
And the wide block is rarely the slow algorithm anyone suspected. Far more often it is JSON serialisation of large objects inside a loop, logging on the hot path, a regex compiled per iteration instead of once, or an ORM quietly issuing N+1 queries. Profile the real workload, find the wide block, fix that one, then profile again to confirm it moved.
Intuition about performance is usually a memory of the last problem, not evidence about this one.