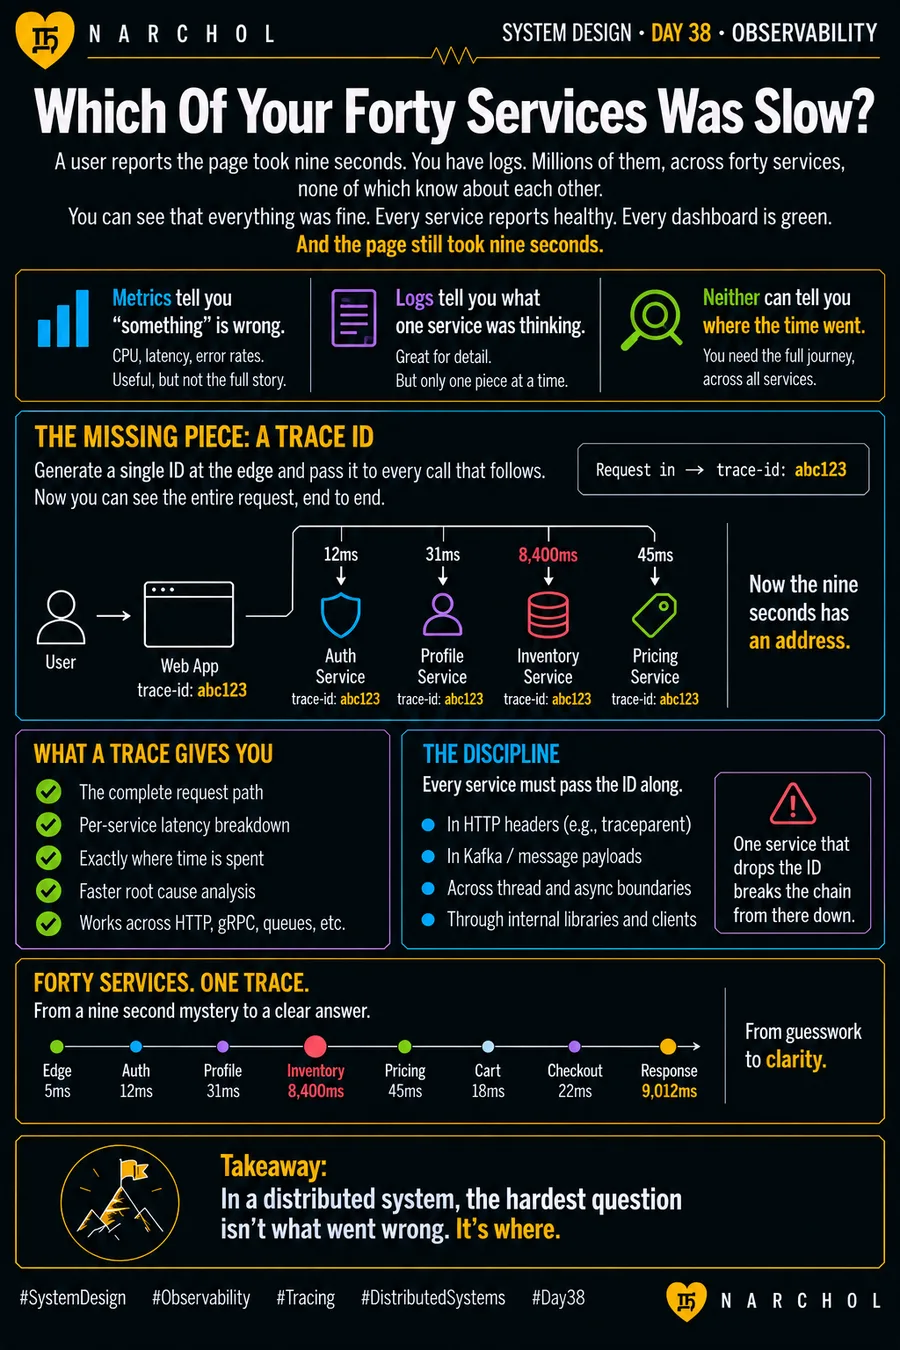
A user reports the page took nine seconds. You have logs — millions of them, across forty services, none of which know about each other. Every service reports healthy. Every dashboard is green. And the page still took nine seconds.
Metrics tell you something is wrong: CPU, latency, error rates. Logs tell you what one service was thinking, in detail, one piece at a time. Neither can tell you where the time went, because the time went on a journey no single service can see.
The missing piece is a trace ID. Generate one at the edge, pass it to every call that follows, and the request becomes visible end to end. Auth 12ms. Profile 31ms. Inventory 8,400ms. Pricing 45ms. The nine seconds now has an address.
The discipline is the hard part. Every service has to pass the ID along — in HTTP headers, in Kafka payloads, across thread and async boundaries, through internal libraries and clients. One service that drops it breaks the chain from there down.
Working out what went wrong is the easy half. Where is the hard one.